Car maintenance and investment portfolio management have more in common than you’d think.
With cars, there’s always a maintenance check, a tune-up, a balancing, or a part needing replacement. Some years, a simple top-off or tire pressure check are enough to stay at cruising speed. Other years, serious maintenance is required to maintain a steady drive.
An investor’s job is similar, always monitoring and replacing pieces as needed. At LWP, we’ve been conducting plenty of maintenance this year on client portfolios as the road turned from smooth to rocky.
A year for major shifts
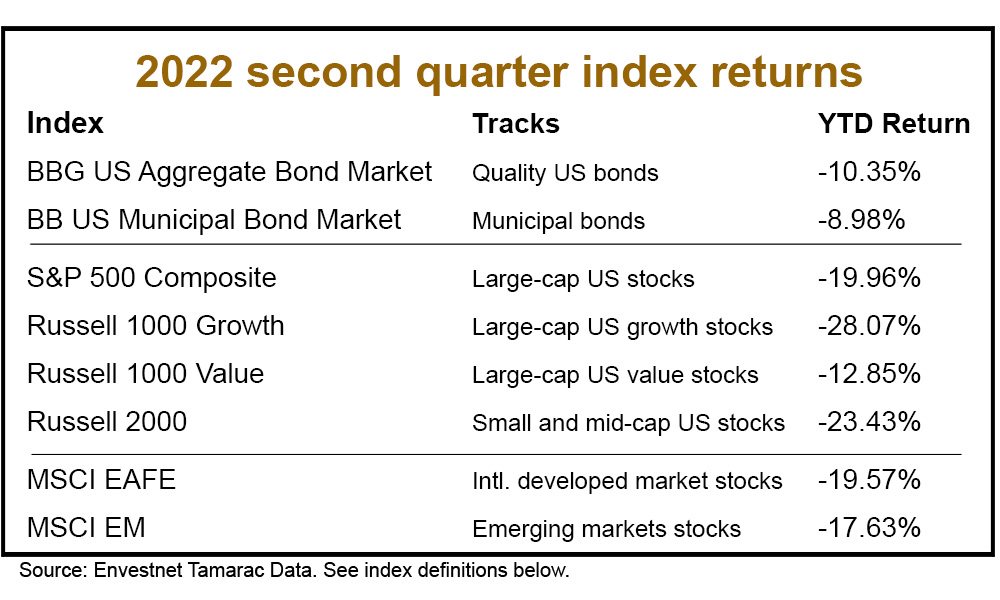
Each of the benchmark indexes lost value in 2022, which last happened in 2015.
Bonds, normally the steady ballast for portfolios, have been negatively impacted by the Federal Reserve’s interest rate hike trajectory, persistent inflation, and declining expectations for economic growth. This year has been the worst year for bonds in five decades. They’ve returned -11% since the start of the year.
The positive for bond investors is that the interest rates on bonds are finally paying respectable rates once again. Bond yields are the highest in nearly 11 years. That’s a long way from last year, when a 10-year U.S. treasury bond paid little more than a savings deposit.
Stocks have not been immune from the bumpiness either. U.S. stocks have now entered bear market territory (down -20% from the January all-time high) and have had the worst start to the year in 60 years. Stocks were at nearly the highest valuation in 25 years at the beginning of the pandemic but now sit below the 25-year average. Growth stocks are down nearly -28% while dividend-paying, high quality stocks are down -13%.*
Preventative maintenance
Investor John Templeton once said, “Bull markets are born on pessimism, grown on skepticism, mature on optimism and die on euphoria. The time of maximum pessimism is the best time to buy, and the time of maximum optimism is the best time to sell.”
As the market outlook changed from maximum optimism to pessimism, our maintenance actions have been both defensive and offensive. We have performed the following, as suitable:
Playing Defense:
- Moved stock allocations to neutral as compared to target vs. overweighting
- Increased allocation to dividend-paying, defensive stocks vs. growth-oriented stocks
- Adjusted international stock exposures more towards defensive stocks
- Increased inflation hedges
- Positioned bonds defensively and added bond alternatives to cushion the impact of increasing interest rates
- Added to bonds tools we think are more defensive to recession risk
Playing Offense:
- Executed a “buy-low” or added to the stock portion of portfolios when the S&P 500 traded past key support levels in February and June, primarily targeting dividend-paying, high quality value-oriented stock tools
- Prepared portfolios to add to stocks should additional opportunities materialize. As contrarian investors, we think markets can overrun on the upside and the downside as investors may focus on short-term news rather than long-term fundamental conditions.
Recession no longer a whisper word
In the first quarter of the year, recession was very much a whisper word for economists. Going into the year, both the U.S. and global economy were expected to grow at an above average pace, but growth expectations have moderated rapidly to below average levels (around 1.7% for the U.S. and 2.9% for world growth).
This change was due to persistent inflation from the war in Ukraine, a tight labor market that’s driving up costs and stifling growth, and interest rate hikes throwing ice-water on the level of activity in the economy. Many economists now see a 30-45% chance of a mild recession over the next two months (defined as a 2.0% – 2.5% contraction of the economy over two or more consecutive quarters).
While we expect a 1 in 2 chance of a recession over the next two years, we see this contraction as more mild and shorter than events like the financial crisis of 2007-2008. Why?
- Health Check: Consumers and corporations have historically high levels of cash, which can provide a bolster for turbulent periods.
- Normalizing Conditions: The value of assets like bonds have been distorted by record government intervention in markets. Recently, tools like government bonds are starting to resume their role as a risk mitigator for investment portfolios. Stock as well are returning to below-average valuations. We’ve seen a sequential deflation in the high prices of assets – bonds, growth stocks, and credit. The more steam that is let off, the lower the risk of an implosion across investment types.
- Fed-Driven Inflation: Tighter monetary policy is arguably a driver of the current risk of recession. Seeing a tight labor market, the Fed has broken the emergency glass and opted to run the risk of recession in favor of controlling high prices. An inflation caused by too tight monetary policy (high interest rates rates) will likely be more limited by an inflation caused by too loose policy.
What does this mean for investors? On average, U.S. stocks drop -3% in the year leading up to a recession. Stocks dropped -37% during the ’07-’08 financial crisis, broadly considered one of the worst stock market declines in history. In context, stocks are currently down over -20% since the market high this year. While stock returns are certainly pessimistic in 2022, companies are still anticipated to grow profits in 2022 and 2023. Profit growth is the fundamental anchor for long-term stock returns.
Performance measurement
As of this quarter, across all our client reports and portal, we have standardized utilizing Time Weighted Return (TWR) as a performance measure and completely replaced the usage of Internal Rate of Return (IRR).
Both are valid measures, but we believe TWR provides a clearer comparison with benchmarks and offers a better “apples-to-apples” measurement of performance because IRR can be skewed by contributions and distributions.
Please reach out to us with any questions. Your advisor will highlight any noteworthy differences between using TWR for performance and IRR for performance during your next review.
Notes and index definitions
* We use the Russell 1000 Growth Index as a proxy for Growth Stocks and the Russell 1000 Value Index as a proxy for Value stocks. See additional index definitions. Returns from Tamarac.
Bloomberg U.S. Aggregate Bond Market Index: A representation of SEC-registered, taxable, and dollar denominated securities. The index covers the U.S. investment grade fixed rate bond market, with index components for asset-backed securities, government and corporate securities, and mortgage pass-through securities. Must be rated investment grade (Baa3/BBB- or higher) by at least two of the following rating agencies: Moody’s, S&P, Fitch; regardless of call features have at least one year to final maturity and have an outstanding par value amount of at least $250 million.
Bloomberg U.S. Municipal Bond Market Index: Covers the USD-denominated long-term tax-exempt bond market. The index has four main sectors: state and local general obligation bonds, revenue bonds, insured bonds and pre-refunded bonds.
S&P 500 Composite: Representing approximately 80% of the investable U.S. equity market, the S&P 500 measures changes in stock market conditions based on the average performance of 500 widely held common stocks. It is a market-weighted index calculated on a total return basis with dividend reinvested.
Russell 1000 Growth Index: Russell 1000® Growth Index measures the performance of the large cap growth segment of the US equity universe. It includes those Russell 1000 companies with higher price-to-book ratios and higher forecasted growth values. The Russell 1000 Growth Index is constructed to provide a comprehensive and unbiased barometer for the large-cap growth segment. The index is completely reconstituted annually to ensure new and growing equities are included and that the represented companies continue to reflect growth characteristics.
Russell 1000 Value Index: The Russell 1000® Value Index measures the performance of the large cap value segment of the US equity universe. It includes those Russell 1000 companies with lower price-to-book ratios and lower expected growth values. The Russell 1000 Value Index is constructed to provide a comprehensive and unbiased barometer for the large-cap value segment. The index is completely reconstituted annually to ensure new and growing equities are included and that the represented companies continue to reflect growth characteristics.
Russell 2000 Index: The index measures the performance of the small-cap segment of the US equity universe. It is a subset of the Russell 3000 and includes approximately 2000 of the smallest securities based on a combination of their market cap and current index membership.
MSCI EAFE (Europe, Australasia, Far East) Index: A free float-adjusted market capitalization index that is designed to measure the equity market performance of developed markets, excluding the U.S. and Canada. As of June 2, 2014, the index consists of 21 developed market country indices: Australia, Austria, Belgium, Denmark, Finland, France, Germany, Hong Kong, Ireland, Israel, Italy, Japan, the Netherlands, New Zealand, Norway, Portugal, Singapore, Spain, Sweden, Switzerland, and the United Kingdom.
MSCI Emerging Markets (EM) Index: A free-floating index offered by Morgan Stanley that captures mid and large capitalization stocks across more 26 countries including many in S. America, Eastern Europe, Africa, the Middle East, and parts of Asia, including Indonesia, the Philippines, and Taiwan.

Laura, the founder of LWP, is a Senior Wealth Manager, Chief Investment Officer and Shareholder. She has a master’s degree in tax and is an excellent listener. While she is a sophisticated financial planner with experience in complex issues, her priority is ensuring a financial plan works for people.


