2021 was a banner year for stocks, but it also held market and economy twists that few predicted. As writer and educator Laurence J. Peter says, “An economist is an expert who will know tomorrow why the things he predicted yesterday didn’t happen today.”
As we manage client portfolios, we incorporate our best economic forecasts. Meanwhile, we seek to be contrarians — to potentially “beat the crowd” when parts of the market heat or cool quickly.
Inflation
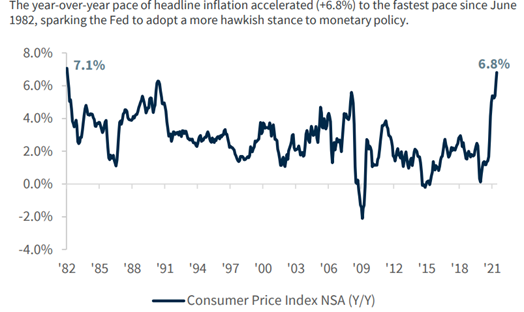
Perhaps the biggest surprise of 2021 was the return and the persistence of inflation. We’ve seen record price increases on goods and commodities from natural gas in Europe to lumber in Canada to used cars in the U.S.1
Inflation was spurred on by supply chain issues, labor shortages, surprise consumer spending and trade imbalances. It rose from 2.6% in March to 6.8% in November, the highest year-over-year increase since 1982.
Central banks like the Fed scratched their heads when raising interest rates seemed like an inappropriate mechanism to cool inflation.2
Our strategies: As suitable, we removed our gold/precious metals exposure from portfolios in the third quarter and pivoted to a more diversified approach of hedging inflation. We progressively added equities with exposure to real assets like infrastructure and real estate that help hedge against inflation.
Market surprises and focuses
The markets generated several surprises for investors, too. Day traders caused stocks like GameStop and AMC Theaters to skyrocket from the doldrums, crash, and then rocket back up again.4 Cryptocurrencies also rode a roller coaster — swelling early in the year, selling off 50% mid-year, recovering to new highs in November, and trailing off again in December.5
A combination of new restrictions on capital markets and the excessive risk-taking of real estate developers caused investors to flee from China. Investors flocked to neighboring markets like Vietnam, which saw a banner year for stocks and influx of capital.6
Infrastructure legislation and climate action were key focuses for investors. The $1T U.S. infrastructure bill passed, while the $2T Build Back Better act or “social infrastructure” bill still hangs in the balance.7 At the U.N. climate conference, over a hundred countries agreed to stricter environmental and climate change mitigation goals.8 Meanwhile, interest in ESG investing drove electric vehicle maker Tesla’s market value to surpass the entire S&P 500 segment of fossil-fuel energy companies.9
Our strategies: We have been progressively reducing exposure to Chinese stocks in relevant portfolios. Our active allocation to green infrastructure benefited from the bipartisan infrastructure bill in the third quarter.
U.S. stocks
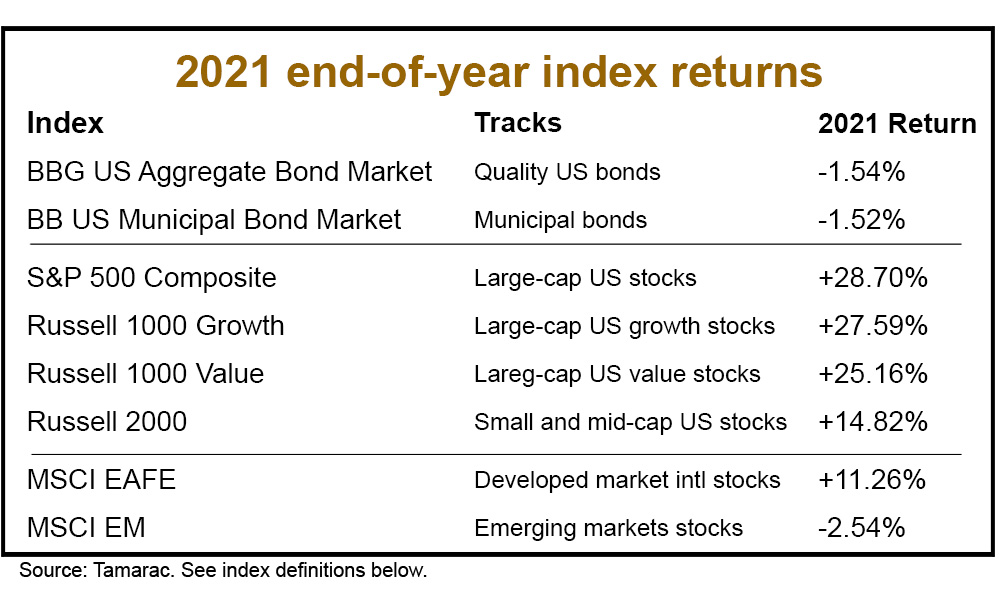
U.S. stocks faired well in 2021. Record company profitability, a rebound of economic activity, a strong consumer, and supportive Fed policy drove the S&P 500 index to hit 70 highs over the year.10 The S&P 500 ended the year ahead 28.7%, the third straight year of double-digit gains for U.S. stocks.
Much of the gains were driven by large technology stocks, such as Apple, which became the first company to hit a $3 trillion market cap.11 Technology stocks returned 34.5% for the year. The worst performing stock sectors of 2020 — energy and real estate – performed well in 2021. The energy sector ended the year up 54.6%, while the real estate sector ended up 35%.
Although large company value stocks started the year hot, growth stocks ended up being the best performing style of the year. They were bolstered by relatively low interest rates, growing profitability, and tailwind demand for technologies and semiconductors. Small-cap and international stocks trailed the performance of U.S. stocks.12
In contrast, the U.S. bond market was down. It ended the year 1.5% lower as investors expect higher interest rates in 2022 and the end of federal stimulus.13
Our strategies (implemented as suitable): We allowed equities to run overweight up to 5% more than your target and bonds underweight up to 5% below your target. Equities offered compelling returns in comparison with bonds, which had a “negative” yield after inflation in 2021.
We tilted more towards value stocks in the first quarter to benefit from the “reopening trade.” Then we moved more towards a balanced approach of owning both growth and value stocks toward the end of the year.
We also progressively oriented bonds towards quality and shorter duration in response to higher rates. Bonds, we believe, still provide a time-tested anchor in a storm for your portfolio. At the end of the year, we increased our allocation to bond alternatives vs. traditional bonds as we expect higher interest rates in 2022. We feel our allocation to Treasury Inflation Protected Securities has been a good antidote to inflation and low bond yields.
Looking to 2022
Looking ahead, we’re positive on the strength of the U.S. consumer, the recovery from the Omicron coronavirus variant, the potential for continued U.S. economic growth, low unemployment, strong hiring trends, and higher wages. We’re more cautious on sticky inflation impacting the bottom line of U.S. consumers and companies.
Global stock valuations are still attractive relative to the U.S., so we still think a risk-managed active allocation to international stocks is important diversification.14
The gap between the highest and the lowest value U.S. stocks is at a 25-year high. This means that investment tools that actively pick stocks are in a good position to add value to portfolios.15
Owning stocks that can pass along inflation (infrastructure, for instance) will be an important pillar, even if inflation moderates later in the year.
Although investors are expecting less supportive fiscal policy and higher rates, we think it is still important to be flexible in bond portfolios. This means (as suitable) owning bond alternatives, while still having a sizeable allocation to bond tools that provide ballast and mitigate inflation.
Change in performance measurement
As of this quarter, we moved from using the Internal Rate of Return (IRR) as a performance measure to Time Weighted Return (TWR) on clients’ quarterly reports.
Both are valid measures, but we believe TWR provides a clearer comparison with benchmarks and offers a better “apples-to-apples” measurement of performance because IRR can be skewed by contributions and distributions.16
Please reach out to us with any questions. Your advisor will highlight any noteworthy differences between using TWR for performance and IRR for performance during your next review.
Index definitions
Bloomberg U.S. Aggregate Bond Market Index: A representation of SEC-registered, taxable, and dollar denominated securities. The index covers the U.S. investment grade fixed rate bond market, with index components for asset-backed securities, government and corporate securities, and mortgage pass-through securities. Must be rated investment grade (Baa3/BBB- or higher) by at least two of the following rating agencies: Moody’s, S&P, Fitch; regardless of call features have at least one year to final maturity and have an outstanding par value amount of at least $250 million.
Bloomberg U.S. Municipal Bond Market Index: Covers the USD-denominated long-term tax-exempt bond market. The index has four main sectors: state and local general obligation bonds, revenue bonds, insured bonds and pre-refunded bonds.
S&P 500 Composite: Representing approximately 80% of the investable U.S. equity market, the S&P 500 measures changes in stock market conditions based on the average performance of 500 widely held common stocks. It is a market-weighted index calculated on a total return basis with dividend reinvested.
Russell 1000 Growth Index: Russell 1000® Growth Index measures the performance of the large cap growth segment of the US equity universe. It includes those Russell 1000 companies with higher price-to-book ratios and higher forecasted growth values. The Russell 1000 Growth Index is constructed to provide a comprehensive and unbiased barometer for the large-cap growth segment. The index is completely reconstituted annually to ensure new and growing equities are included and that the represented companies continue to reflect growth characteristics.
Russell 1000 Value Index: The Russell 1000® Value Index measures the performance of the large cap value segment of the US equity universe. It includes those Russell 1000 companies with lower price-to-book ratios and lower expected growth values. The Russell 1000 Value Index is constructed to provide a comprehensive and unbiased barometer for the large-cap value segment. The index is completely reconstituted annually to ensure new and growing equities are included and that the represented companies continue to reflect growth characteristics.
Russell 2000 Index: The index measures the performance of the small-cap segment of the US equity universe. It is a subset of the Russell 3000 and includes approximately 2000 of the smallest securities based on a combination of their market cap and current index membership.
MSCI EAFE (Europe, Australasia, Far East) Index: A free float-adjusted market capitalization index that is designed to measure the equity market performance of developed markets, excluding the U.S. and Canada. As of June 2, 2014, the index consists of 21 developed market country indices: Australia, Austria, Belgium, Denmark, Finland, France, Germany, Hong Kong, Ireland, Israel, Italy, Japan, the Netherlands, New Zealand, Norway, Portugal, Singapore, Spain, Sweden, Switzerland, and the United Kingdom.
MSCI Emerging Markets (EM) Index: A free-floating index offered by Morgan Stanley that captures mid and large capitalization stocks across more 26 countries including many in S. America, Eastern Europe, Africa, the Middle East, and parts of Asia, including Indonesia, the Philippines, and Taiwan.
Sources
1. United States Inflation Rate, tradingeconomics.com and US inflation rate rose to 6.8% in 2021, its highest since 1982, The Guardian
2. The supply chain and the shipping container shortage, a brief history, Vox
3. Raymond James Research
4-5. In a Wild Year for Markets, Stocks Pull Off Big Gains, Wall Street Journal
6. Vietnam stocks hit new milestone in record run, Reuters
7. Biden signs $1 trillion bipartisan infrastructure bill into law, cnbc.com and Here we go again: Build Back Better is back on the Senate stage, The Washington Post
8. 4 Key Takeaways From COP26, foreignpolicy.com
9. TPW Advisory Monthly: The Tri Polar World in An Age of Speed, Northern Trace Capital
10. In a Wild Year for Markets, Stocks Pull Off Big Gains, Wall Street Journal
11-13. JP Morgan Research
14-15. JP Morgan Economic & Market Update
16. Global Investment Performance Standards for Asset Owners, CFA Institute and Time-Weighted Return vs. Internal Rate of Return, Commonfund
Past performance is no assurance of future results. Laurel Wealth Planning (“LWP”) is a registered investment adviser with its principal place of business in the State of Minnesota. A complete list of all recommendations will be provided if requested for the preceding period of not less than one year. It should not be assumed that recommendations made in the future will be profitable or will equal the performance of the securities in this list. Opinions expressed are those of LWP and are subject to change, not guaranteed and should not be considered recommendations to buy or sell any security. Any reference to a chart, graph, formula, or software as a source of analysis used by LWP staff is one of many factors used to make investment decisions for your portfolio. No one graph, chart, formula, or software can in and of itself be used to determine which securities to buy or sell, when to buy or sell them, or assist any person in making decisions as to which securities to buy or sell or when to buy or sell them. Any chart, graph, formula, or software used is limited by the data entered and the created parameters. The data was obtained from third parties deemed by the adviser to be reliable. Nonetheless, the adviser has not verified the results and cannot be assured of their accuracy.

Laura, the founder of LWP, is a Senior Wealth Manager, Chief Investment Officer and Shareholder. She has a master’s degree in tax and is an excellent listener. While she is a sophisticated financial planner with experience in complex issues, her priority is ensuring a financial plan works for people.